
Diddy, David, Boies and NXIVM: A Litigation Fire in Dallas

A federal filing in the Eastern District of Texas threatens to expose a web of corporate ties, witness testimony and cross‑border evidence that could reshape how Fortune 500 companies handle digital records.
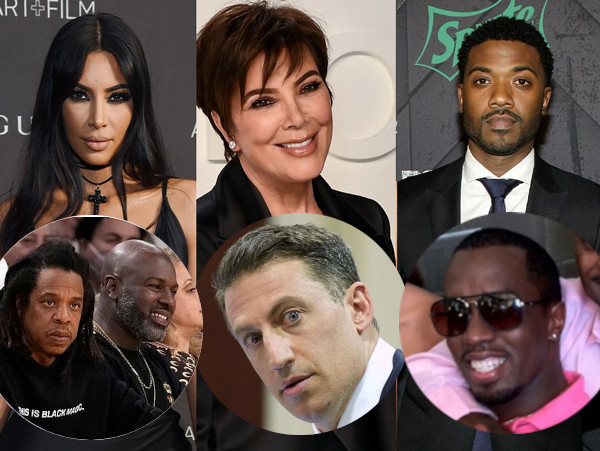
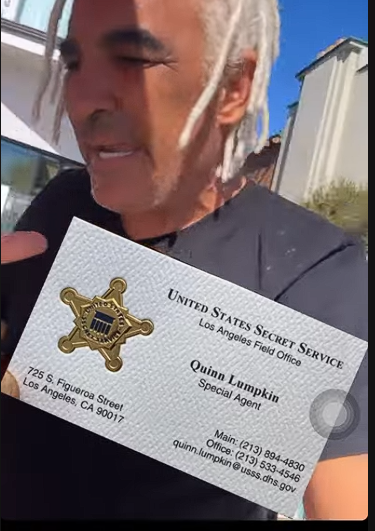
- The case hinges on a dramatic emergency preservation request made by media entrepreneur Alki David to Judge Sean D. Jordan in Dallas. David demands the safeguarding of cloud logs, metadata, chain‑of‑custody notes and other forensic material that could prove or disprove allegations against a constellation of executives – from Sean “Diddy” Combs to David Boies – and institutions ranging from Universal Music Group to CBS. The filing also alleges that Texas courts must coordinate with the Antigua King’s Bench and Privy Council because the same witnesses and data streams travel across borders. With no findings yet, the only message is clear: preserve the evidence, and only then will investigative inquiry be possible.


MORE TOP STORIES
FEATURED
bbc.co.uk
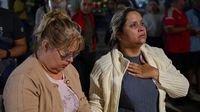
French Women Demand End to Statute of Limitations for Sexual Assault Cases
A powerful twin quake leaves thousands dead in Caracas as the nation grapples with leadership shifts, military domination of disaster response, and acute shortages.
bbc.co.uk
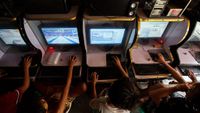
After a 14‑year‑old shooter at Tacloban High was linked to the violent game Gorebox, the Philippines’ cyber‑security agency blocked the app pending review, sparking calls for stricter youth‑gaming controls.
bbc.co.uk
Key figure in South Africa police graft case, Cat Matlala, pleads guilty to bribery and laundering, offering testimony against senior officials under a plea deal.
bbc.co.uk
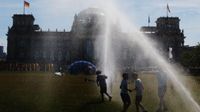
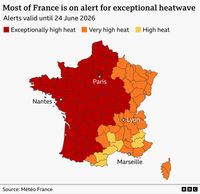
A brutal heatwave sweeps from Spain and France to Germany and the Czech Republic, prompting record temperatures, health alerts and emergency responses.
bbc.co.uk

Advertisment

IBM has revealed a sub‑1 nm chip capable of cramming about 100 billion transistors onto a surface the size of a fingernail, promising 50 % performance gains and 70 % more energy efficiency.
bbc.co.uk
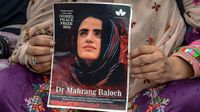
Baloch activist Mahrang Baloch, known for campaigning against enforced disappearances, has been jailed for life after a controversial court ruling.
bbc.co.uk

A new IFS study shows which UK university degrees bring the highest lifetime earnings, with medicine and economics topping the list while creative arts offer little financial return.
bbc.co.uk

From foil blankets to cooling vests, discover how Brits are staying cool during July's extreme heatwave with creative, low‑cost hacks.
bbc.co.uk
Kerala’s new elder‑care department tackles loneliness amid rising migration and an ageing population.
bbc.co.uk
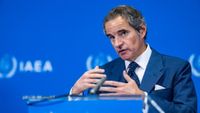
The International Atomic Energy Agency will soon carry out inspections in Iran as part of a new US‑Iran peace agreement, including a supervised dilution of highly enriched uranium.
bbc.co.uk

Advertisement


France records first European Ebola case – doctor returns from Congo
bbc.co.uk
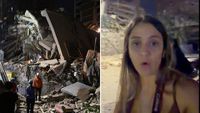
Venezuela's Dual 7.2 and 7.5 Earthquakes Leave Residents in Panic
bbc.co.uk
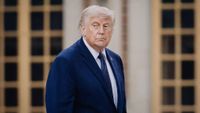
Congress passes war‑powers measure for first time, breaking with Trump over Iran
bbc.co.uk
France's Air‑Cooling Debate Intensifies as Heatwave Reaches 40°C
bbc.co.uk
Quantum‑Heatwave: France’s Cooling Debate Reveals Deep Political Divide
bbc.co.uk

Strait of Hormuz Reopens: 172 Vessels Pass After US‑Iran Armistice
bbc.co.uk
UN Nuclear Chief Confirms IAEA Inspectors Will Visit Iran Sites under New US Deal
bbc.co.uk
bbc.co.uk
Anthropic Accuses Alibaba of Illicitly Extracting Claude AI Capabilities

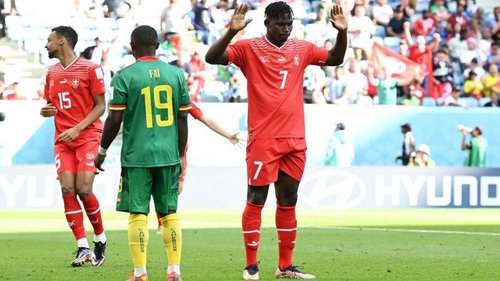
The 2026 FIFA Men’s World Cup saw 289 of the 1,248 squad members born outside the countries they represented, a record 23 % of the rosters. Players like Breel Embolo, Ibrahim Mbaye and Michael Olise chose to play for nations linked to ancestry, residency or naturalisation, sometimes facing their birth countries on the pitch. FIFA’s evolving eligibility rules and the world’s migration patterns have fostered this trend, creating both celebrated successes such as Morocco’s semi‑final run and controversies around national identity. The rise of diaspora talent reshapes football strategy but also raises questions about representation, loyalty and the meaning of a national team.
bbc.co.uk
A devastating fire in a dormitory at Utumishi Girls' School in Gilgil killed 16 students and injured dozens more, sparking a national conversation about school safety. Eight students were arrested after police linked them to the alleged arson, and prosecutors have approved multiple counts of murder for those implicated. The case highlights a growing concern over arson in Kenyan schools and the need for stricter enforcement of fire safety protocols.
bbc.co.uk
Eight Americans accused of belonging to Antifa were handed a cumulative 450 years behind bars for their roles in a 2025 riot outside the Prairieland Detention Centre in Alvarado, Texas. The sentences range from 30 to 100 years, with a former Marine reservist receiving 100 years for attempted murder of a police officer. The group fired fireworks, set off explosives and vandalised the facility on 4 July, actions the DOJ characterised as an “assault on democracy”. President Trump has long targeted Antifa, designating it a domestic terrorist organisation in 2025. Critics argue that the ideological label lacks a concrete organisational structure and should not criminalise belief.
bbc.co.uk
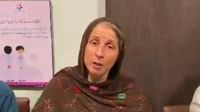
French woman and five children rescued after 12‑year captivity in Pakistan
bbc.co.uk
Ukraine Drone Attack Paralyzes Power Grid in Crimean City
bbc.co.uk

France Faces Record‑High Heat as European Heatwave Swells
bbc.co.uk
Quantum Insights into Western Europe's Record Heatwave
bbc.co.uk

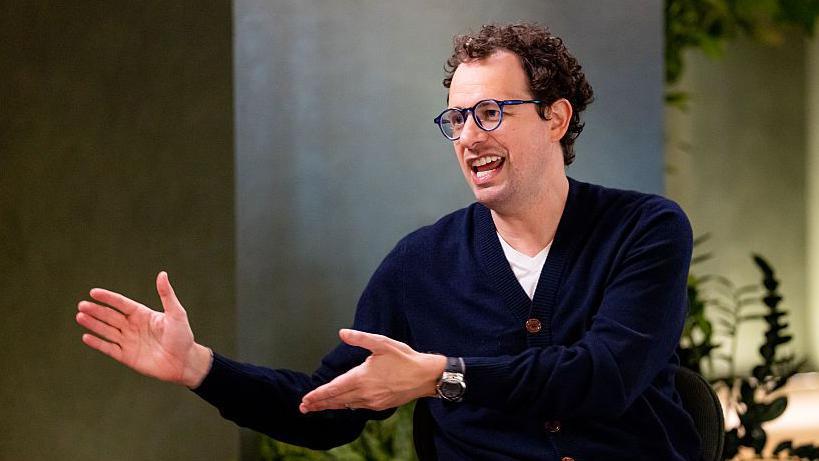
Kunal Shah: From India’s Fintech Maverick to WhatsApp’s New Head
bbc.co.uk
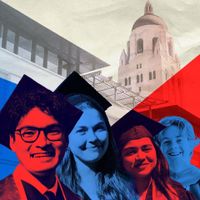
Stanford Graduates Walk Out as AI Debate Sparks Controversy
bbc.co.uk

Ballista Spider: New Web Catapult Seeks Out Green Ants in Australian Rainforest
bbc.co.uk
Featured Sections
BUSINESS

TRAVEL

SPORT
ENTERTAINMENT
OPINION

POLITICS
HEALTH
TECH

Advertisement
Follow us

© 2024 SwissX REDD UK ltd. All Rights Reserved.